


The National Living Wage isn't working
The National Living Wage has not stymied in-work poverty - and increases tend to negatively affect many benefit claimants


From April, the lowest paid employees in the UK will earn £11.44 per hour, rather than £10.42. This is an increase of 9.8%. Let me be clear: increasing the legal minimum that employers must pay their staff is — all things considered — never a bad thing.
There was even better news for young people. 21 and 22 year-olds will become eligible for the National Living Wage (NLW) for the first time, so their minimum hourly pay rises by 12.4%. People aged 18–20, and people under 18 or working as apprentices, will see rises in the applicable minimums of 14.8% and 21.2% respectively.
However, there are some very reasonable grounds to suggest that too much is being asked of the NLW and the minimum wage more generally. The policy is not failing per se; rather, its limitations are becoming apparent. And the NLW’s use as a reference point within various aspects of the benefits system, alongside a failure to increase tax thresholds in line with NLW rises, might suggest that the government is using the NLW rather cynically to manipulate the public finances.
More people are earning the minimum
Since 1999, the number and proportion of jobs ‘covered’ by the applicable minimum wage rate (meaning they are paid at or below the minimum) has risen significantly.
This is partly a story about minimum wage rates ‘catching up’ to what people are already being paid — this is why coverage increased significantly in 2016, when the NLW’s introduction led to a large increase in the minimum rate for people aged 25 and over.

But it is also a story about the waning force of the policy’s spillover effect, i.e. its role in driving up the wages of those paid above the minimum. If the NLW were doing its job in this regard, we would expect to see a stronger spillover effect when minimum rates rise more slowly, but there is little evidence that this is the case.
The main caveat to this account (evident in the chart above) is the most recent period, i.e. since the onset of the COVID-19 pandemic. The implications of the pandemic are explored in depth in the Low Pay Commission’s 2022 report. As labour markets have tightened, employers have had to raise pay above the minimum, to both recruit and retain staff. The coverage trend has gone into reverse: the number of jobs paid at or below the minimum fell from 2 million to 1.6 million between 2019 and 2022.
However, there are caveats to the caveat (not evident in the chart). First, nominal pay has risen, but not at the same pace as prices, so pay has fallen in real terms. (The NLW is of course still not a true living wage.) Second, jobs paid at or around the NLW have become more intense.
Third, inactivity rates have risen for some workers likely to be paid the NLW since the pandemic, specifically older people with low qualifications. So nominal pay growth may be a compositional effect, as the size of the low-paid workforce diminishes, rather than a strengthening of the spillover effect.
In-work poverty is increasing
We cannot assume therefore that the pandemic’s impact heralds a new normal in the UK labour market. What has become depressingly normal, however, is poverty among working households.
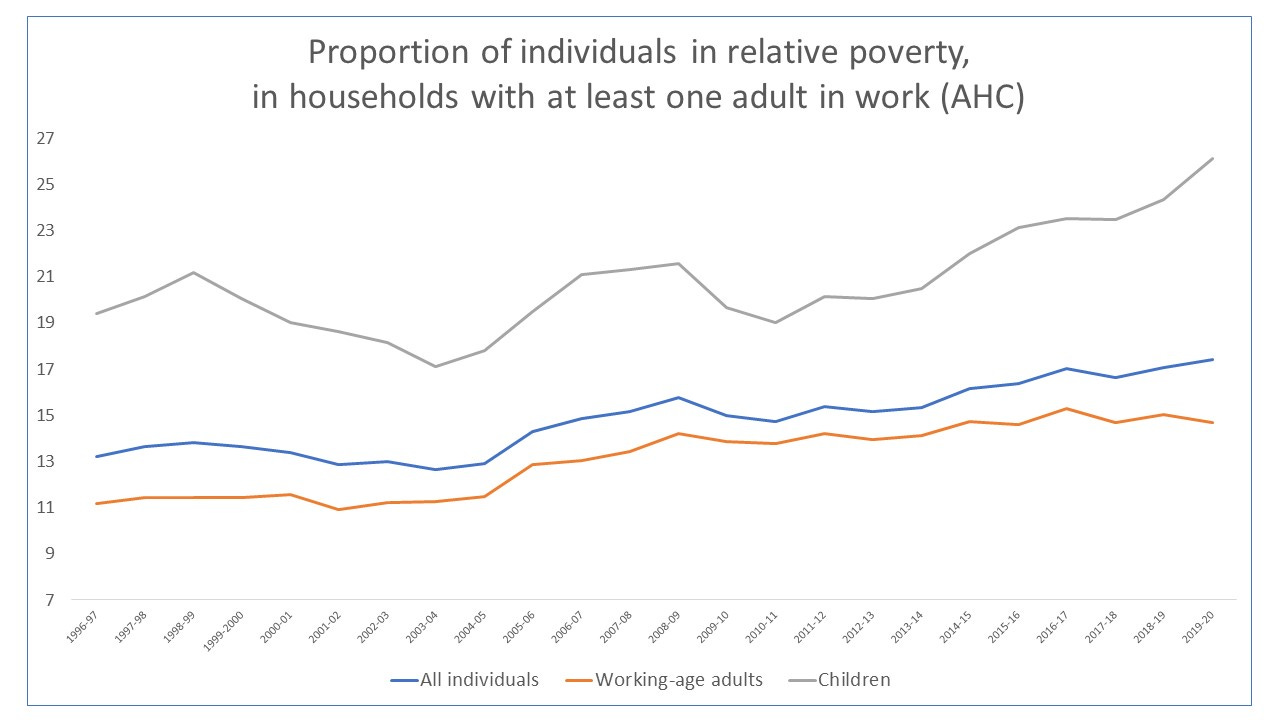
As the first chart below shows, after housing costs (AHC), 11% of working-age adults in relative poverty lived in households where at least one adult was in work in 1996/97. This was largely stable until 2004, but rose to 15% in the year before the pandemic.
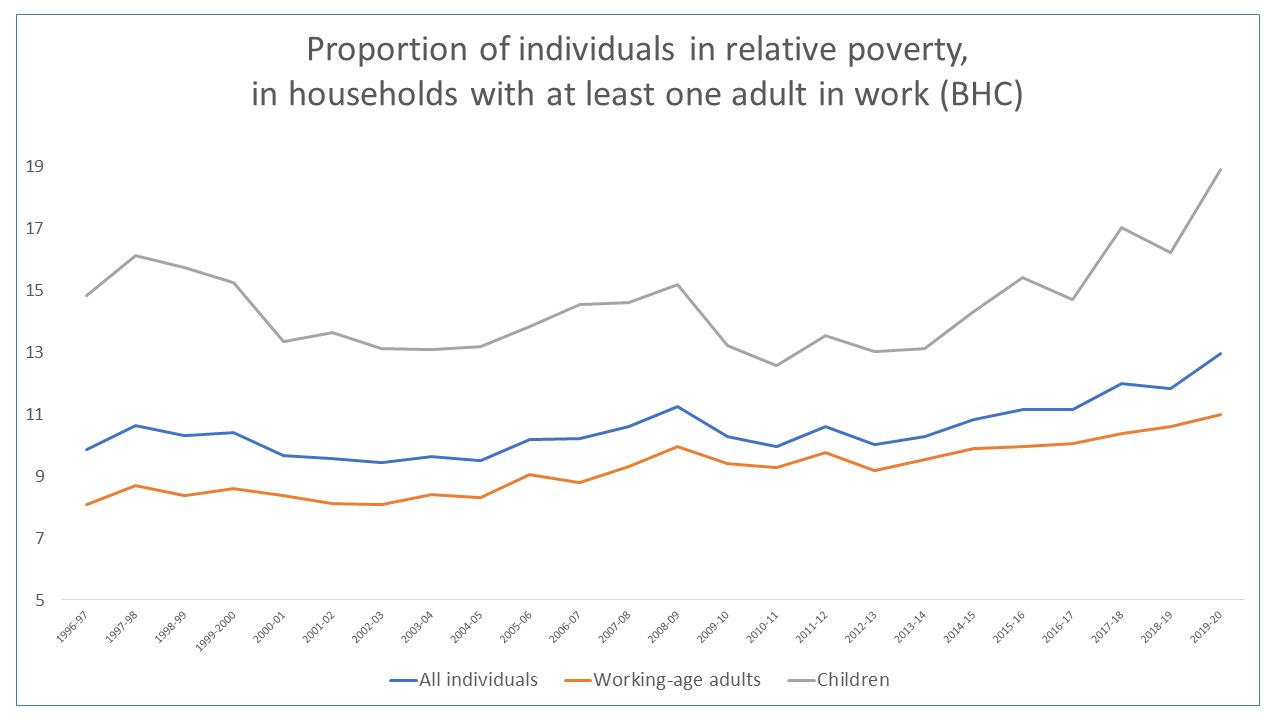
Worse, 26% of children in relative poverty lived in households where at least one adult was in work, in the year before the pandemic. The proportion had been only 19% in 2010. (For completeness, the second chart below shows the proportions on a before housing costs [BHC] basis.)
This does not mean that the NLW and minimum wage regulations more generally are not helpful for addressing in-work poverty — they are necessary but not sufficient.
One of the issues here is that, while minimum wage increases have helped to reduce hourly pay inequality in the UK, weekly pay inequality remains stubbornly high — indeed higher than any other major European economy. This has been explored in depth by the Economy 2030 Inquiry.
The trend relates in part to the highly-paid becoming even more highly-paid. But it is also due to low-paid employees working fewer hours — effectively by choice. Higher job intensity (noted above), difficulties accessing childcare, and poor public transport all limit the hours people are able to work. (At the same time, under-employment is now lower than in recent decades: as a result of these structural barriers, people are no longer even trying to increase their hours.)
In-work poverty and income inequality are a product, to some extent, of this rebalancing towards part-time employment.
They are also a product of the rise of low-paid self-employment. Whereas the self-employed have historically earned more than employees, in the year before the pandemic almost 40% of self-employed workers had low hourly pay, compared to around 15% of employees. To state the obvious, the self-employed are not protected by minimum wage rates.
Higher earnings do not always mean higher income (except for the Exchequer)
The benefits system is part of the in-work poverty problem too: the erosion of the value of income-related benefits since 2010 is one of its the main drivers.
And insofar as higher earnings lead to benefit income being withdrawn, employees often see a much more modest rise in take-home pay than is implied by the headline increase in the NLW and other rates. You are almost always better off earning an additional £1 than not, but most people will not be better off enough to have a material impact on the prospect of in-work poverty.
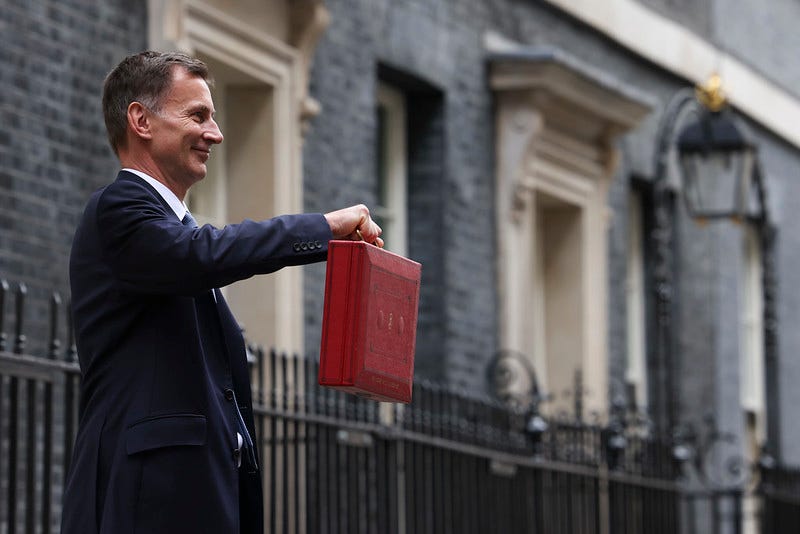
This has been compounded by Jeremy Hunt’s decision to freeze tax and National Insurance allowances — a policy which will now remain in place until 2027/28. This means that, as earnings rise, the low-paid see a greater proportion of their pay becoming subject to tax. (This is only slightly mitigated by the small cut in National Insurance rates in 2024, a measure which mainly benefits higher earners.)
The overall effect is described as ‘giving with one hand’ by Nye Cominetti. By definition, employers are financing 100% of the minimum wage increases being proclaimed by the government, but the majority of this additional outlay — either indirectly through benefit withdrawal or directly through higher tax revenues — is captured by the Exchequer. As Gareth Morgan remarks:
It’s difficult not to admire the skill with which the government presents themselves as giving generously, actually gives the worker little, makes the employer pay all the costs and takes the bulk of the money for themselves.
Furthermore, with the NLW rising faster than benefits are being uprated, many claimants will lose their eligibility for income-related benefits altogether. This could leave them substantially worse off: they were probably only receiving small amounts of benefits such as Universal Credit, Housing Benefit and tax credits, but these also provided passported eligibility for things like Cost of Living Payments and the Warm Homes Discount.
For many claimants, the rise in take-home pay due to higher earnings will not adequately compensate for the loss of these discretionary payments — at a time when low-income households are still facing steep increases in living costs.
The punitive role of NLW increases
So far, I have focused on the impact (or lack thereof) of increases in the NLW in terms of the actual amount that actual employees will actually be paid. However, the NLW also has a range of less direct applications.
It is used as a reference point for various rules within the benefit system — and raising the NLW invariably makes it more difficult for some claimants to qualify for additional support, or avoid punitive measures. The end result, again, is that government spending falls.
It is now harder to avoid the benefit cap
The benefit cap is a limit on how much benefit income a single household can receive — it has been a major driver of increasing child poverty since 2013. Next year, like most years since its introduction, the cap will be frozen. However, its earnings-related exemption, which allows some working households to escape the cap, is linked to the NLW, so will not be frozen. The cap is equivalent to working 16 hours per week with earnings at the NLW.
In April, the threshold is accordingly expected to rise from £722 to £793 per month. Those already working the required hours, earning NLW, will see no impact. But people with slightly higher hourly pay (whose earnings will not rise as a direct result in increasing the NLW) who work fewer hours each week (in order to, for example, care for their children) may now see their earnings fall below the exemption threshold. Their benefit income will therefore become subject to the cap.
It is now harder to access free school meals
To qualify for free school meals (FSMs) in England and Wales, a household must have earnings of no more than £7,400 per year. When this cut-off was introduced in 2018, it was equivalent to working 18 hours per week, earning the NLW.
With the threshold frozen ever since, from April 2024 it will be equivalent to working around 12 hours per week, earning the NLW. As a result, far fewer low-income households will qualify for FSMs for their children. Falling off this cliff will cost them almost £500 per year.
It is now harder to escape conditionality
The Administrative Earnings Threshold (AET) in the Universal Credit system determines the extent of conditionality that a claimant may be subject to. The AET is linked in regulation to the NLW: a single person must have earnings equivalent to 15 hours per week earning the NLW in order to be eligible for ‘light touch’ conditions. (Couples must collectively work for 24 hours per week.)
If they earn less than this equivalent — a threshold which will rise sharply in cash value as the NLW increases — they will be placed in an intensive work search (IWS) regime with requirements to seek a higher paid job. The IWS regime comes with the threat of sanctions if these requirements are not upheld.
As above, people already working the required hours at the NLW will not be affected by this change. Again, however, people earning slightly more than the NLW, but working fewer hours due to childcare, may be caught out. Whereas their earnings this year lift them out of conditionality, next year — as the threshold rises, but their earnings do not — they will be subject to IWS conditions.
Self-employed people are collateral damage
The presumption that self-employed people could deliberately restrict their own earnings in order to qualify for income-related benefits means the Universal Credit system includes expectations around what they should be earning. These expectations are linked to NLW.
A self-employed claimant’s ‘minimum income floor’ (MIF) is usually equivalent to working 35 hours per week at the minimum wage rate for their age group. For those aged 23 or above, the MIF will rise with NLW from £1580 per month to £1735 per month in April 2024. (And now that the NLW applies to 21 and 22 year-olds, this higher MIF rate will apply to them too if they are self-employed.)
The significance of the MIF is that the government will calculate your benefit entitlement based on its value even if you are actually earning a lower amount. A higher MIF means a higher earnings assumption, and therefore more benefit income being withdrawn.
To repeat the obvious, minimum wage rates do not apply to the self-employed. Some people in self-employment may benefit from spillover, but for those who combine employment and benefit income the downsides of a higher NLW are likely to outweigh the theoretical upsides. The low-paid self-employed may of course already be earning considerably less than the legal minimum for employees, and ‘platform’ workers have little scope to raise prices to increase their earnings.
Conclusion
The minimum wage is a social policy, not an economic policy. Indeed, this was reinforced when George Osborne misappropriated the notion of a living wage to justify a sharp rise in the minimum rates for most employees in 2016.
However, the potential impact on employment always seems to be the main criteria against which the policy is judged. The question we should be asking is whether the minimum wage is helping to address poverty.
Other things being equal, the policy is not unhelpful in this regard (not least because it does not lead to lower employment). Alas, other things are not equal. The economy is not creating enough good jobs. Employment regulation more generally has facilitated a boom in low-paid and insecure self-employment. Crumbling social and physical infrastructure is preventing people from working, or working more. And the benefits system is failing to ensure people — especially families with children — are able to meet their essential living costs.
If the minimum wage is an inadequate social policy, why does the government continue to rely on it? Because it is a social policy financed by employers — overwhelmingly private sector employers.
I am fine with that, in theory: I think the NLW should actually be even higher. But it is essential that, in return for this expectation, employers have the opportunity to benefit from greater investment in skills, innovation, and infrastructure by the public sector. This is also how we will create the good jobs that will enable more people to earn more than the minimum.
Instead, the government uses the fiscal dividend of a higher NLW — from higher nominal tax revenue and lower benefit spending — to finance tax cuts for higher earners. If that is what the NLW is really for, then perhaps it is working quite well after all.
Smoke and mirrors comes to mind, as usual with any 'help' this government gives to improve life for those people who need it.